
When we officially launched FACTS Data Insights last October, we mentioned that it was only the beginning…and now we’re releasing three more powerful dashboards!
Available on March 2, Phase 2 of Data Insights includes new dashboards designed to help schools proactively manage cash flow, evaluate financial aid effectiveness, and monitor enrollment health across the student/family journey.
Let’s take a closer look at these new dashboards and what they can help your school discover.
**Not sure what we’re talking about? Don’t worry. Check out our Data Insights FAQ blog for a refresher on what it is, who can use it, and more.
Delinquency Management
At a glance: Look beyond basic balances to understand what’s driving delinquency and view historical trends
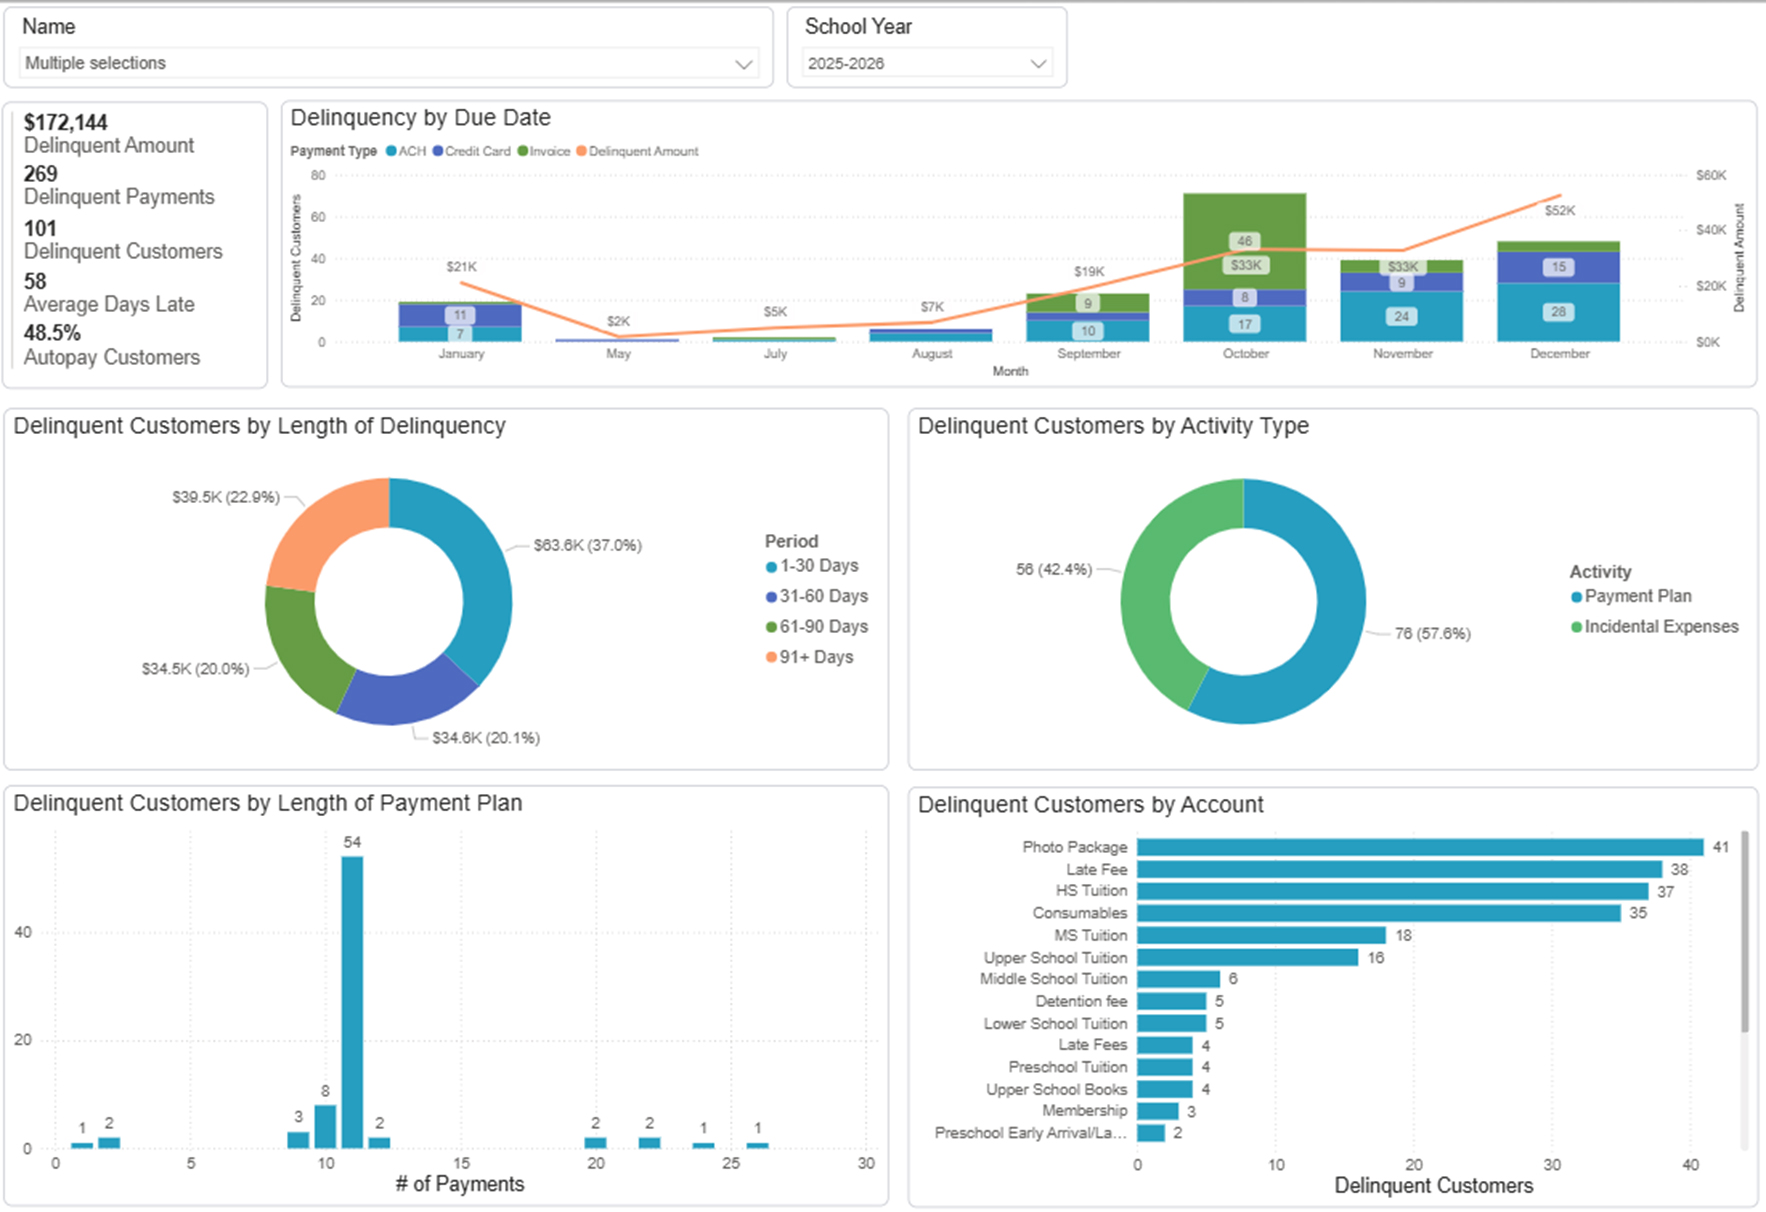
The Delinquency Management Dashboards help you understand underlying trends that may be driving account delinquencies. By combining financial and demographic data, you can uncover trends to support more proactive collections planning.
Instead of pulling separate reports from multiple systems, leaders can now:
- View historical delinquency trends year over year
- Identify patterns by demographic data, time period, payment method, and more.
- Explore interactive dashboard filters
In Action
Your finance team notices an increase in past-due balances mid-semester. By using the Delinquency Management Dashboards, you can determine whether the trend is tied to a specific type of bill, payment plan length, certain demographic data, autopay enrollment, and more, and adjust communication, policies, or payment structures proactively.
The goal is not just reporting what happened. It’s seeing patterns early enough to respond and make changes.
Financial Aid Effectiveness
At a glance: Explore how tuition, needs, income, demographic data, and awards work together to measure the impact of your financial aid strategy.
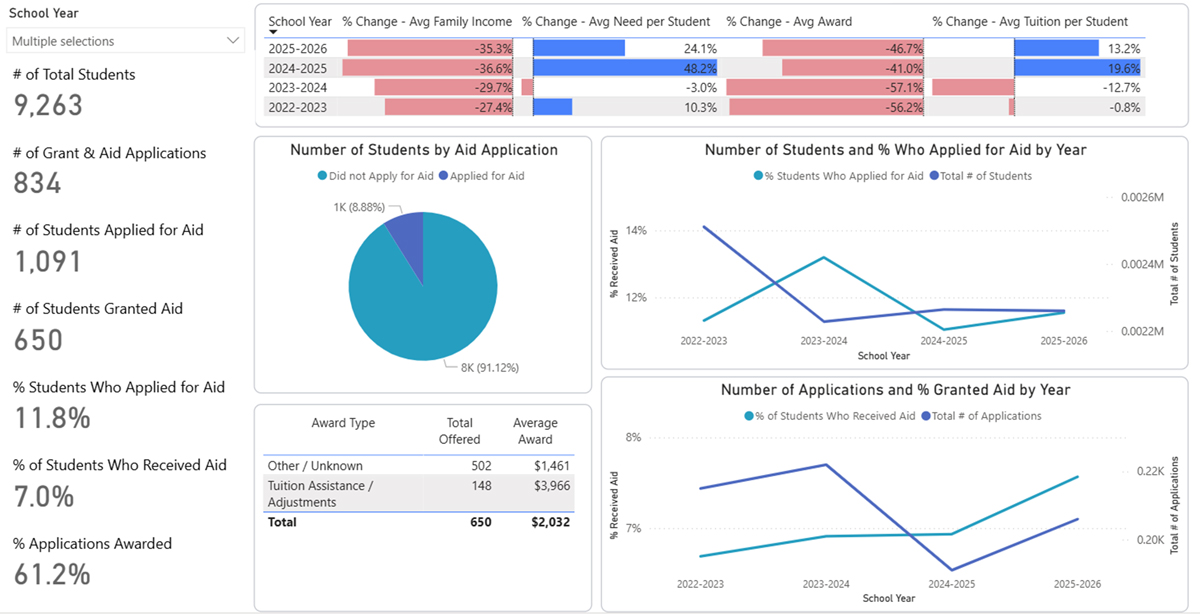
The Financial Aid Effectiveness Dashboards provide an in-depth analysis of financial aid applications, offers, and awards. By combining financial, demographic, and enrollment data, schools can evaluate not just who is receiving aid, but how effectively those dollars are supporting student success and school enrollment.
These dashboards provide more insight into:
- Trends in applications, offers, and award amounts
- Economic and demographic profile of families receiving aid
- Tuition coverage and award amounts by grade, income bracket or group, and more
- Downstream impacts on enrollment longevity and graduation rates
In Action
Your leadership team is evaluating next year’s tuition strategy. Using the Financial Aid Effectiveness Dashboards, you can assess whether aid recipients are returning at comparable rates to non-recipients and determine whether your current allocation strategy is supporting long-term retention goals.
Rather than relying on anecdotal evidence or assumptions, you can use data to guide financial sustainability and accessibility planning.
Enrollment Lifecycle
At a glance: Compare demographics across student milestones, as well as relevant data from other integrated solutions.
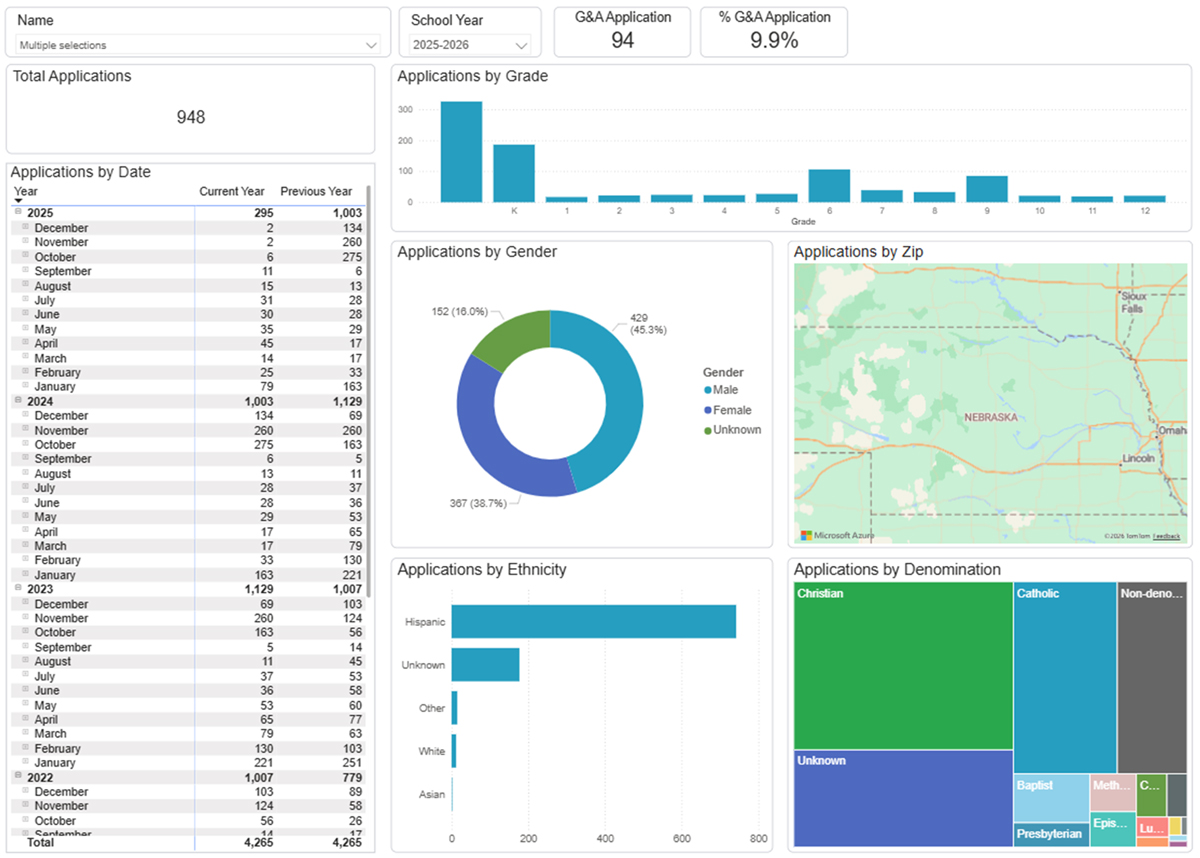
The Enrollment Lifecycle Dashboard provides visibility into five possible major milestones in a student’s tenure:
- Inquiry
- Application
- Enrollment
- Graduation
- Withdrawal
By visualizing movement across these stages, your school can see where gaps can be addressed and identify trends that might otherwise go unnoticed before they become unmanageable.
In Action
If inquiries are strong but applications are declining, the data shown in this dashboard may signal a weak point in your application process. If withdrawal trends are increasing at a specific milestone, leadership can investigate root causes before the impact compounds year over year.
Instead of reacting after enrollment numbers shift, schools can monitor leading indicators throughout the family journey.
How to Access the New Dashboards
Data Insights is included at no additional cost for eligible FACTS clients using multiple products across financial management, enrollment, and student information. Visit our Data Insights page to learn more!
From Fragmented Reporting to Proactive Leadership
School leaders shouldn’t have to reconcile multiple reports just to understand enrollment health or financial risk.
With the addition of Delinquency Management, Financial Aid Effectiveness, and Enrollment Lifecycle dashboards, FACTS Data Insights continues to evolve, providing high-level, actionable insights that support confident, proactive decision-making.
As we mentioned during our initial launch, FACTS Data Insights will continue to grow and evolve, so stay tuned for more updates.
Want to share your thoughts about all things Data Insights? Join the conversation on FACTS^SPACE.
Recent Blogs
- Simplify Childcare Compliance with Smarter Attendance Tracking
- Educational AI and School Management Tools: What Schools Need to Know in 2026
- A Teacher’s Guide to AI Prompting
- Testing the Waters: How to Try AI Without Sinking
- Campus and School Management Systems: What They Are, Why They Matter, and How Schools Should Evaluate Them
